EATB – A faster way of combing through mass data
An efficiency-enhancing tool for developers and quality management

The Enterprise Data Analytics Toolbox (EATB) quickly identifies key points in vast sets of measured data and performs statistical analyses. It also generates reports with compelling graphics for instant use in presentations to management or customers. These time-saving features are a significant advantage to developers in their demanding daily work.
Take, for example, a usage scenario involving a recently roadtested new brake system. Several terabytes of measured data have been uploaded to a server. The next step is to start the workflow that the brake designer has come to know and appreciate. The designer opens the ETAS Enterprise Data Analytics Toolbox (EATB), selects a template with predefined criteria for assessment, and runs the analysis. The program soon identifies all points in this vast set of measured data where parameters need to be adjusted, and generates an interactive graphical report.
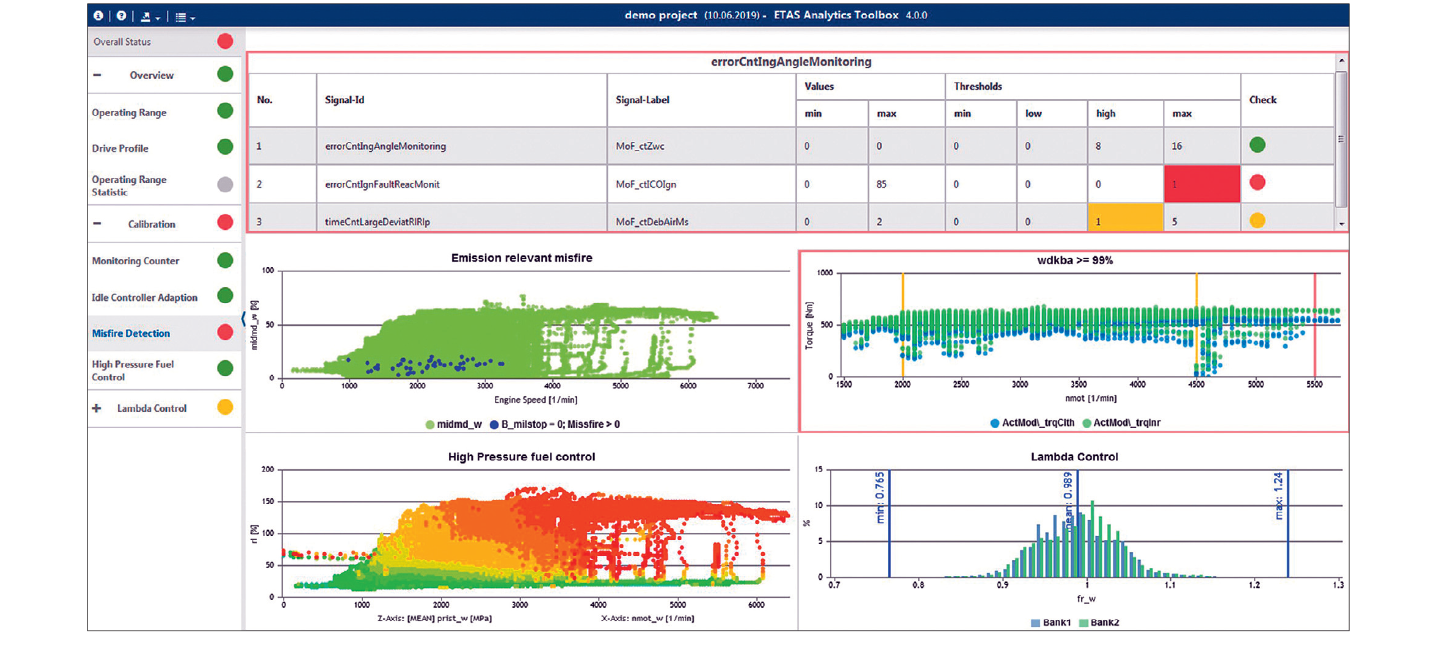
The EATB visualizes statistical analyses for both physical and computed signals. It also displays the timeline and threshold events where values exceed the limits. A traffic light provides a clear indication of the status: Green means the calibration is good to go, with no need to take further action. Yellow indicates variance within a certain range of the threshold. Red indicates a deviation extending beyond the threshold value.
The data are evaluated automatically at the touch of a button, in a fraction of the time required for manual analysis. This key function of the EATB addresses the needs of application and validation engineers, project managers, and quality assurance teams. They all receive reliable insight into measured data in a minimum of time, which is a big advantage considering the short development lead times and increasing volume of data in today’s development environment.
This report is a great help to the developer, who can then view and edit functions at the parameter level in the Measure Data Analyzer (MDA). With this combination of preliminary analysis and focused deep dive, the engineer is able to work quickly, yet with great precision. The generated reports are flexibly configurable. Another great advantage is that they are interactive. A specialist can easily zoom in on any dataset to see the results in higher resolution. Other tools’ PDF reports lack this capability.
With the current status so easily ascertained, these reports also support efficient communication. Generated in lean HTML5 format and stored on a web server, they are readily accessible to everyone with a stake in the project and viewable in any standard internet browser, even on mobile devices. The reports can be integrated into presentations without further editing or formatting.
Developed with users for users, the EATB is born of practical experience. The measurement data format (MDF) can be read and processed directly. The EATB is compatible with data sourced from the ETAS INCA software and other systems.
The templates used by the EATB offer many more benefits. Ideally, a MATLAB® user configures a customer-specific set of criteria for analysis in the given template. Once the know-how needed for key development steps is captured, all developers can benefit from the knowledge archived in the template library. Templates can be adapted for new tasks simply by modifying a few details. The toolbox comes with a manual for creating templates. Template training and services are also available.
The bottom line
ETAS’ Enterprise Data Analytics Toolbox is a powerful tool that quickly analyzes even large amounts of measured data. Its trafficlight color coding makes it easy to spot actionable areas. The EATB offers great potential for boosting efficiency. The reports it creates can be embedded directly in presentations. They also satisfy documentation requirements. Many departments at Robert Bosch GmbH already use the EATB. Efforts are underway to ensure future versions of the toolbox will be usable in the cloud and ready for big data use cases. In this way, the EATB fits seamlessly into a fully virtual and accelerated test environment, where it can also deliver on its strengths.
Author
Andreas Klegraf is responsible for the Enterprise Data Analytics Toolbox at the Product Management Integration and User Experience unit of ETAS GmbH.