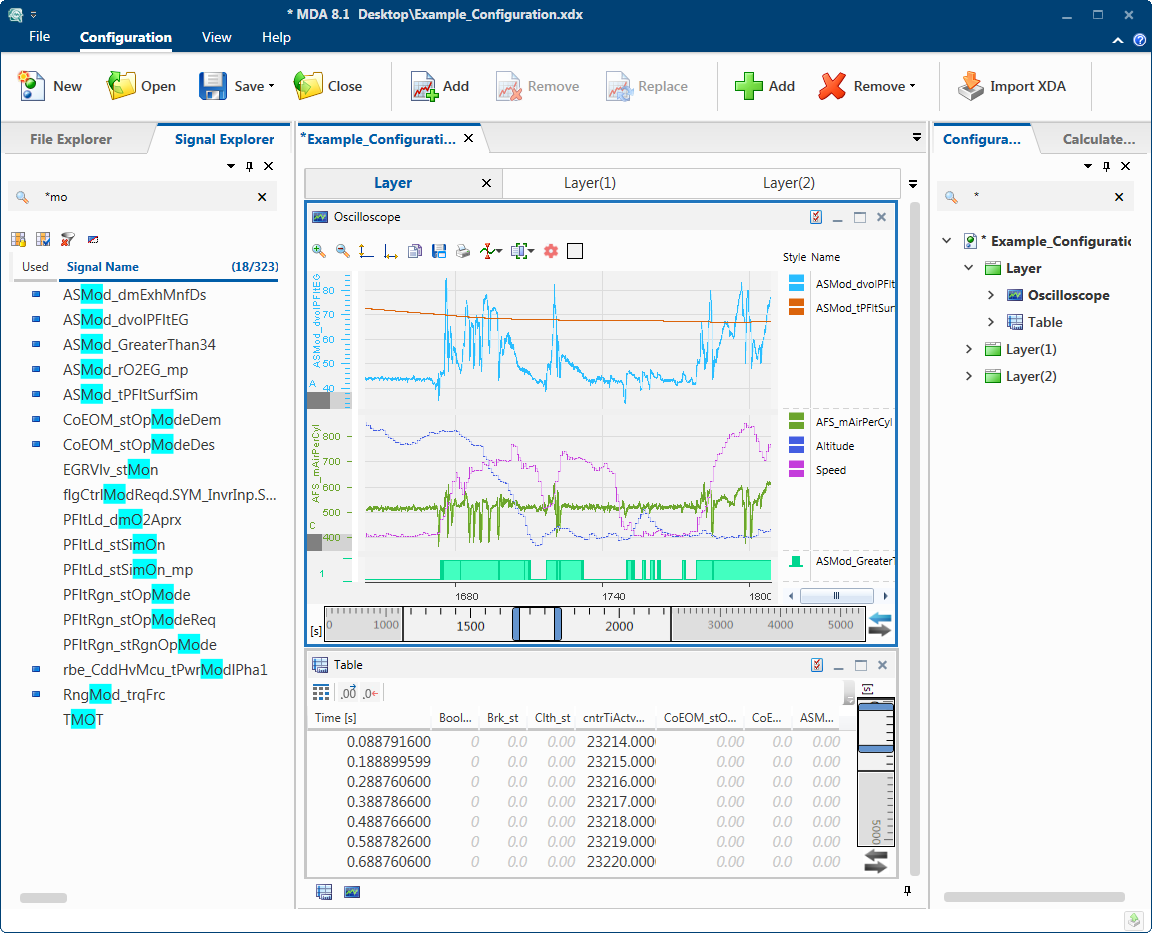
MDA V8 offers a clearly structured user interface, a newly designed virtual oscilloscope, a table tool with an interpolation function, and innovative operating concepts that were developed in collaboration with pilot users. Many functions make work easier. For example, the intuitive time slider allows users to zoom out to short timespans in long measurement series and conveniently reposition them along the measurement series. The user interface is available in German, English, French, Japanese, and Chinese.
Based on the measured signals, users can enter formulas to calculate derived signals in just a few steps. To this end, the tool includes an intuitive formula editor that lets users quickly define calculation rules and, if necessary, combine them with predetermined functions.
You will find a detailed overview of the MDA V8 functions here.
MDF-compatible
MDA V8 can read and write all versions of the MDF (Measurement Data Format) file format. In particular, it supports the indexation and compression of measurement data in line with ASAM specification MDF V4.1. Selected signals and periods can easily be extracted from the original measurement data and saved as a new MDF file.
In addition, users can convert files between the different versions of the MDF format. Configuration files generated with version 7.2 or older can be imported into MDA V8 and used as normal.
Adjustment of measurement grids
Thanks to the high processing speeds in MDA V8, measurement files with several hundred thousand signals in several thousand measurement grids can be opened and processed quickly.
MDA V8 can prepare data for special applications, such as the adjustment of measurement grids. For example, if MDF files for analysis are based on different measurement grid units, MDA V8 enables users to adjust the data so that measurement signals are based on identical measurement grids. If necessary, the adjustment function can also be used to interpolate any missing values.
Continuous improvements
The range of functions offered by MDA V8 is expanded on a quarterly basis. You will find the latest service pack and information about it in the Download Center.
Application areas
The MDA V8 data analysis tool can be used for a variety of applications:
- Visualization and evaluation of ECU and vehicle measurement data
- Evaluation of extensive measurements
- Data extraction from measurement files
- Conversion of MDF formats
- Adjustment of measurement grids
Benefits
- Intuitive use
- Fast processing with numerous signals and large measurement files
- Fast zooming and scrolling in long measurement series with oscilloscope
- Easy calculation of derived signals
- Consistent data management when applying a time offset to a measurement file
- Simple comparison of relevant findings using cross-instrument synchronization
- Easier interpretation of the measurement data thanks to the direct connection to EHANDBOOK and its ability to clearly display the ECU software documentation
Five MDA instruments
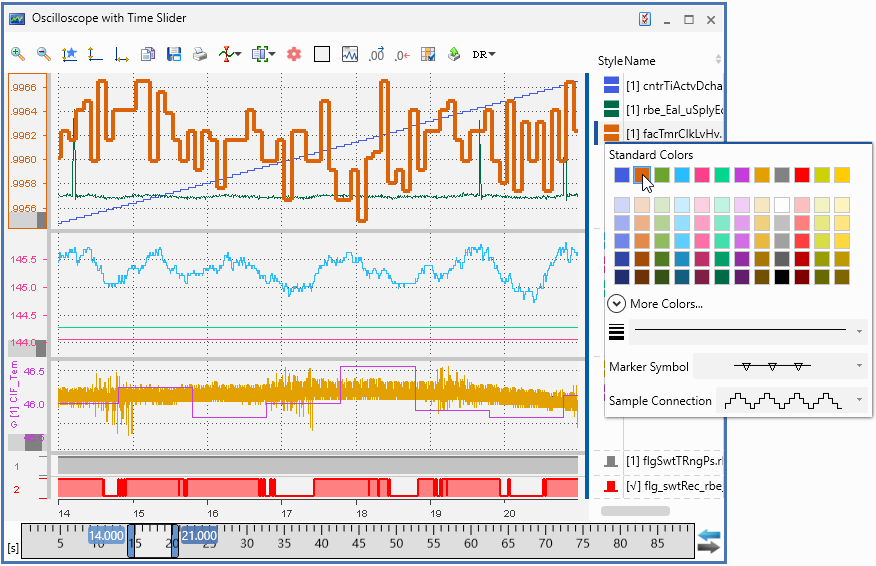
1.) Virtual oscilloscope
In the virtual oscilloscope, the signals are displayed as a function of time. The oscilloscope’s measurements display can be divided into several sections in which signals can be displayed separately from one another. If several oscilloscopes are used, it is possible to synchronize the displays. This includes simultaneous scrolling and zooming along the time axis as well as the cursor movement. The oscilloscope offers a number of configuration options for displaying the signal curves. The instrument’s export function provides the user with the option to write only the specific measurement data for the current time period and the used signals to a new measurement file.
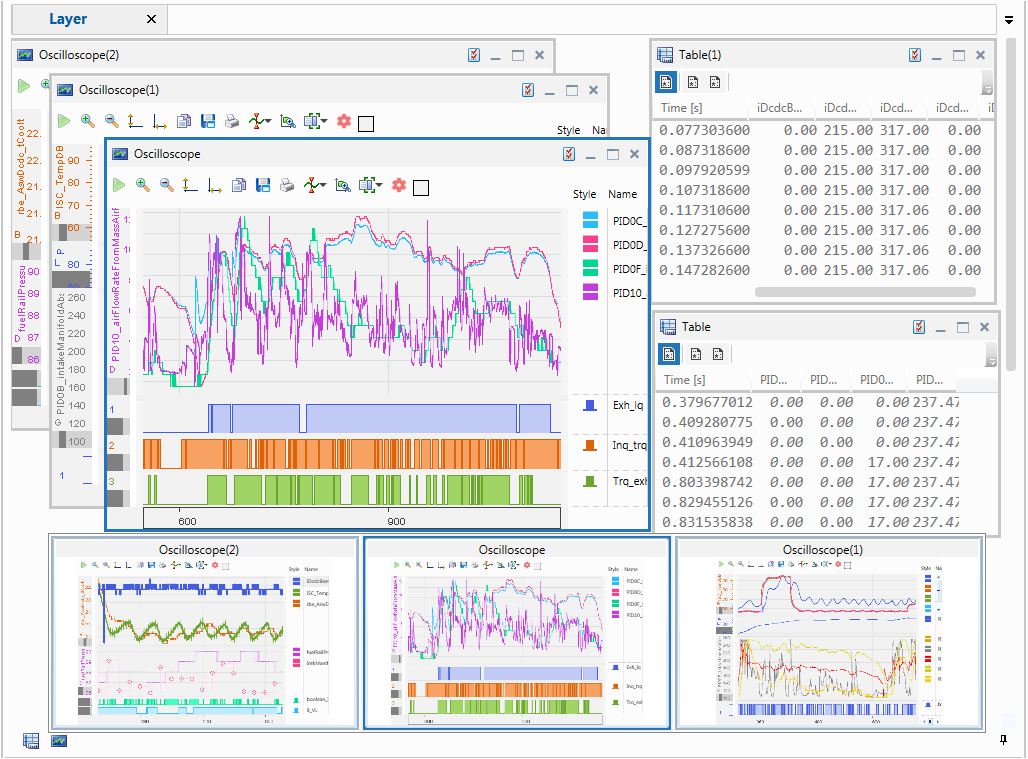
2.) Table view
The table view provides a detailed view of the individual measured values as a function of time. When comparing signals sampled at different frequencies, the user can choose whether only actually measured values are displayed or whether gaps in measured values should be filled in with interpolated data.
When oscilloscopes and tables are synchronized, the active cursor in the oscilloscope becomes a synchronization cursor. It displays the measured values with time stamps in the table and therefore makes it possible to simultaneously display an overview covering a longer time period as well as a detailed view of individual measured values.
3.) Event list
When evaluating measurement files, often only certain events are of interest. Generally, the user can define these events as a signal with a logical condition (true/false), or a corresponding status signal is already present in the measurement file. The event list only contains those time stamps at which the status of the signal changes. Thanks to cross-instrument synchronization, it is easy to examine the relevant time stamps more closely in another instrument (e.g. an oscilloscope) with the help of the results list. And this can be done without first having to navigate through the entire timeline.
4.) Scatter plot
Thanks to the scatter plot, it is easy to track down outliers in the measurement data and identify correlations between the signals. This instrument furthermore provides a quick overview of the operating ranges in which measured values were recorded. The time slider allows the user to limit the displayed point cloud to a particular section of time in the measurement file. This can also be done in a synchronized state by using the zoom function in an oscilloscope.
5.) Statistics
Basic statistical values, such as minimum, maximum, and average, can be read off in the statistics instrument. Through the synchronization with an oscilloscope, the statistical values are always determined for the section of time displayed there.
Switching between instruments
Miniature views and previews are displayed in the task bar and allow the user to navigate quickly between the various instruments in a layer tab. The active evaluation configuration, its layer tabs, the instruments placed in those tabs, and the signals displayed there are displayed using an Explorer-style interactive tree structure in the configuration manager. Evaluation configurations can be modified easily using the customary drag-and-drop operations. For example, it is possible to drag measurement signals from the configuration manager or signal explorer onto different layer tabs as well as drag display instruments from the instrument box onto layer tabs. The configuration manager is furthermore used for quickly searching for signals that have been used before and for copying instruments. It thus provides the user with a clearly structured way of managing complex evaluation configurations.
