Use Cases
Analysis, reporting, and recalibration: With its MATLAB®-based templates, the EATB is the perfect accompaniment to the calibration, measurement, and diagnostic tool chain in the ETAS world. But the EATB can also be deployed as a standalone product – as an open system, it is compatible with products from the ETAS world as well as with many non-ETAS products. It does, however, develop its full potential when used in combination with other ETAS products.
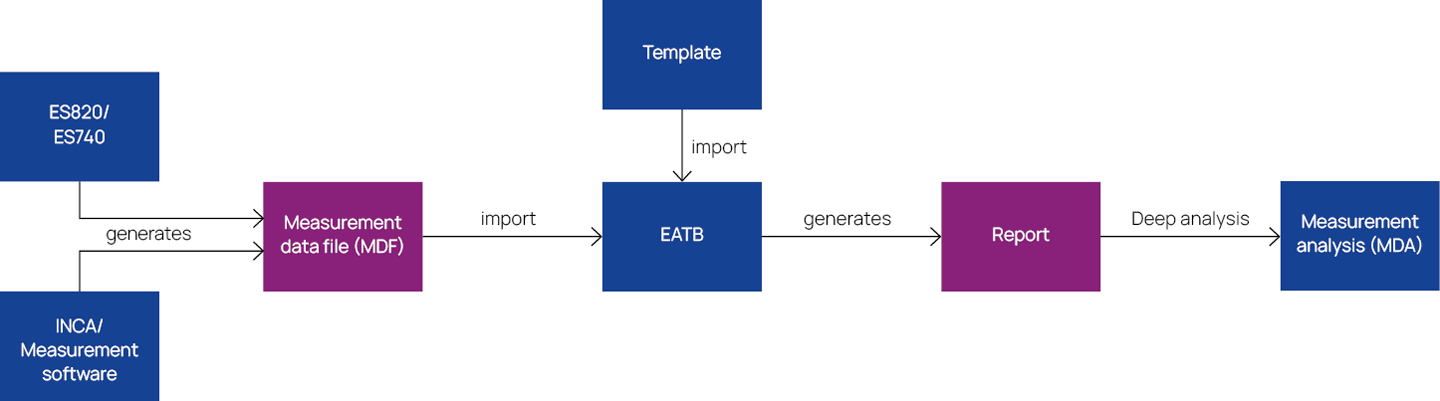
Working with the EATB is based on two interlinked workflows for different use cases that are as straightforward as they are effective. In the first step, data is generated and converted into a measurement data file (MDF). It does not matter whether this data is generated directly in the vehicle or in a virtual environment like ETAS INCA.
In the local use case, MDF files are analyzed on a laptop or desktop computer using the EATB. The EATB searches, structures, and analyzes the large volumes of data automatically based on a template programmed with parameters that the user is free to define as needed. This minimizes the likelihood of errors and amount of time spent. Afterwards, the EATB creates an interactive report that provides the project participants with a quick overview of the measurement results. The report makes it easy to identify the areas in which calibration engineers and other engineers need to subsequently make adjustments to improve the ECU software. For a detailed, in-depth analysis of the relevant areas, the data can easily be transferred to the Measure Data Analyzer (MDA).
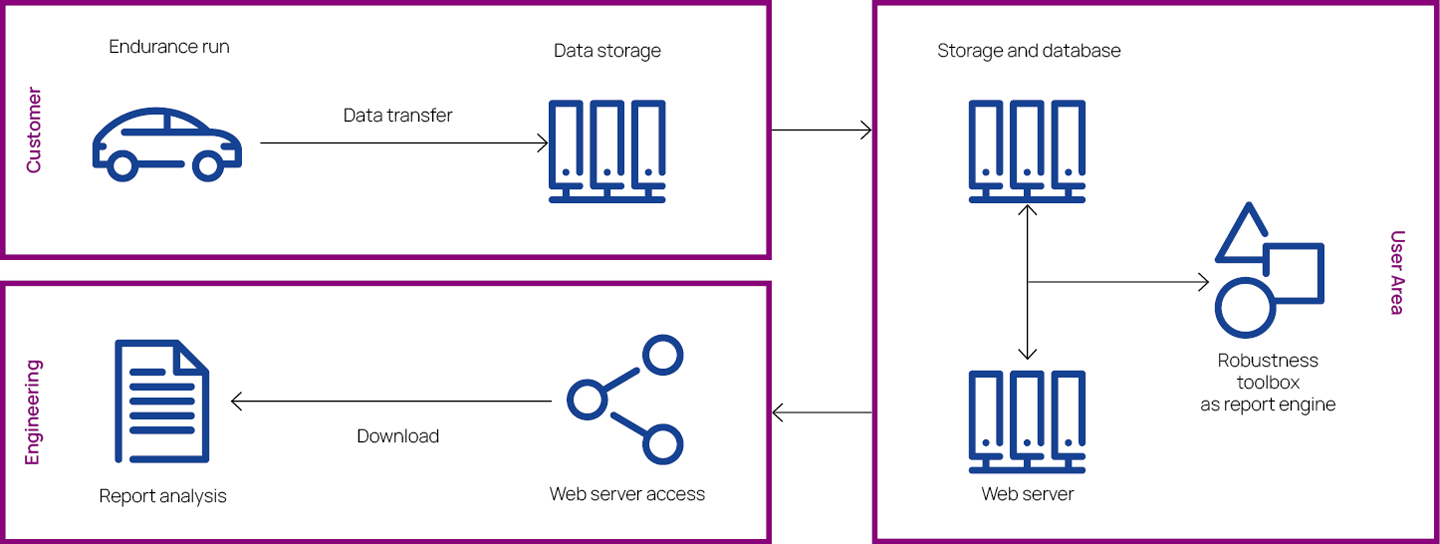
The developer team can benefit from a strong boost in efficiency through the automated use case. Once the underlying template has been created or graphically defined via the EATB user interface, the process is fully automatic for all measurements and takes only a short time. The measurement data generated in each subsequent test run is automatically uploaded to a server and analyzed by the EATB on the basis of the preset template. The team then receives the clearly structured report directly after the test run. The EATB can thus be used to optimize the entire workflow and boost efficiency.
Templates
MATLAB-based templates are used as the basis for the calculations and subsequently generated report. Various criteria, such as parameters and their limit values, can be defined in the templates and processed with MATLAB precision.
Users are free to adapt the template design. They can customize the precise configurations as they wish. The EATB can therefore be easily tailored to individual requirements and specific tasks.
The openness of the system offers a further benefit: The templates enable specialist knowledge to be stored within the company. For example, a template that evaluates the drivability of a vehicle can be adapted to a later vehicle variant with a few changes. A further template can thus be created without much effort, and each project participant can afterwards directly identify and understand the areas in which the vehicle variants differ.
After the templates have been created, they can be stored on a central web server and then used by any teams and employees in the company without the need for any further programming. As a result, a considerable template library containing the company’s collected specialist knowledge will grow over time, thus ensuring ever greater effectiveness.
Reports
After analysis of the measurement data, the EATB provides the user with highly customizable, graphically appealing reports in HTML5 format that can be displayed in any standard browser.
The tool visualizes statistical analyses for physical and calculated signals and displays them using a clearly structured, easy-to-grasp traffic light format. Green values indicate that there is no need for any action to be taken and are therefore confirmation of correct calibration. Values shown in yellow indicate there is a deviation from the limit value within a defined range, and red indicates a deviation from the limit value outside the specified range. The user can open up the red and green reports and “drill down” into them to view the relevant sections and charts in detail.
The interactivity of the reports offers the user even more options when analyzing the data. With the mouse pointer, the user can easily select a section of the report and zoom into it to get a more detailed view. The available data can thus be viewed at various depths of detail and the analyses can be gradually fine-tuned. The lightbox display makes it possible to output individual charts as an image gallery. And predefined filters simplify the task of selecting measurement data.
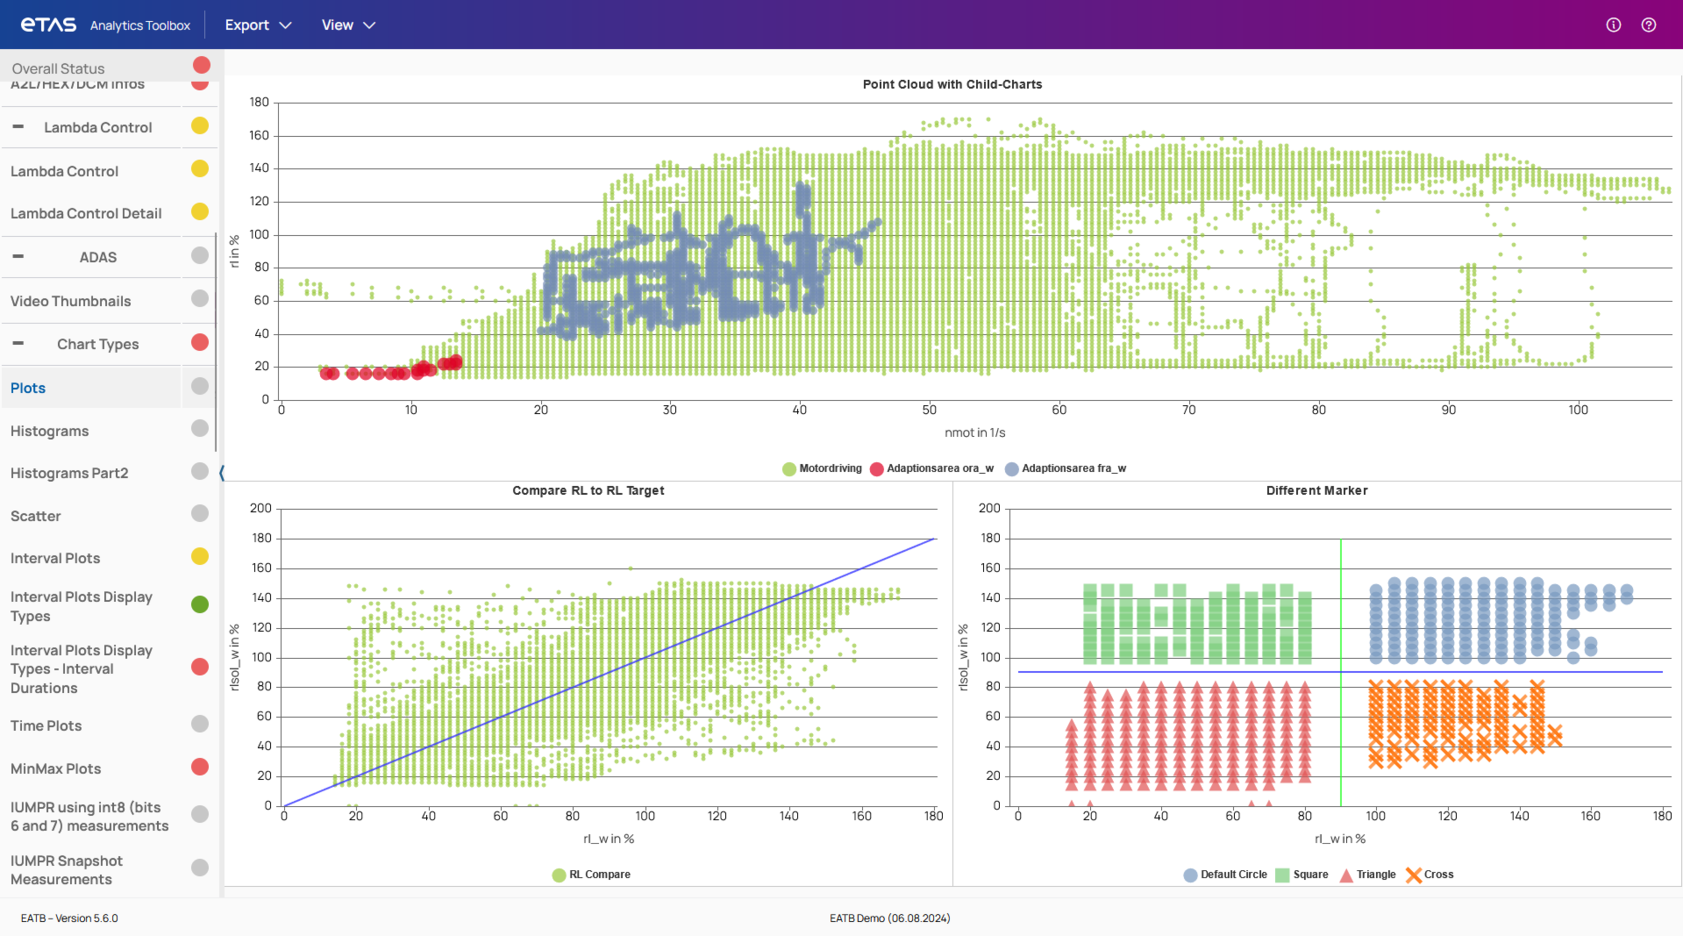
The EATB offers a very broad range of visualization options. They can be used to create a wide variety of charts. Thus, for example, statistical measuring parameters can be displayed very clearly on up to four axes.
The following can be displayed:
- Scatter plots/point clouds of observational pairs
- Histograms for visualizing frequency distributions
- Tabular minimum-maximum charts for checking the diagnosis frequency
- IUMPR ratio from measurements with six- and seven-bit INT8 values
In addition, axes can be scaled logarithmically, text fields can be defined in the charts, measurement fields can be colored, the appearance of the measurement points can be varied in terms of shape and color, and various measurement criteria can be combined according to the specific customer. Depending on the selected chart type, precise information for the displayed values can be shown in tooltips, the interval ranges to be displayed can be defined and, if necessary, data sources and measurement files can be displayed in the MDA. The open interfaces furthermore allow users to expand their own functionalities (using REST interfaces). The JSON exchange format, which is also one of the open interfaces, is available for report viewers.
Alongside facilitating data analysis, the clearly structured reports also enable compliance with the wide-ranging documentation and information obligations towards the company’s management.